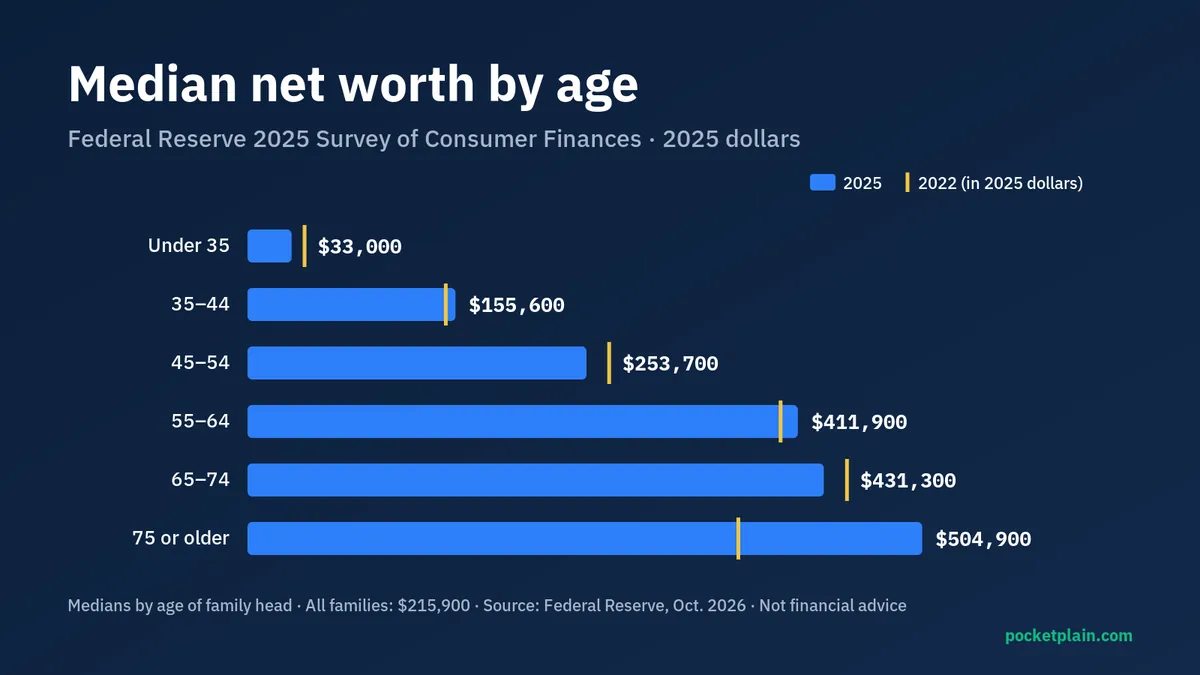
The typical American family's net worth edged up over the past three years, but the gains were lopsided by age. The Federal Reserve's 2025 Survey of Consumer Finances, released Oct. 9, 2026, puts median family net worth at $215,900, up 2% from the 2022 survey after adjusting for inflation. Families younger than 35 saw their median fall 23%, while families 75 and older posted the biggest gain. Federal Reserve announcement
Net worth is what a family owns, such as cash, retirement accounts, a home and a business, minus what it owes. The survey has been run every three years since 1989, and all dollar figures below are in 2025 dollars.
Median net worth by age in 2025
The Fed groups families by the age of the "reference person," generally the head of the household. Here are the medians and means from the Fed's summary report. Federal Reserve, Changes in U.S. Family Finances from 2022 to 2025
| Age of family head | Median net worth, 2022 | Median net worth, 2025 | Change | Mean net worth, 2025 |
|---|---|---|---|---|
| Under 35 | $42,700 | $33,000 | −23% | $135,400 |
| 35–44 | $148,400 | $155,600 | +5% | $681,900 |
| 45–54 | $270,600 | $253,700 | −6% | $1,244,500 |
| 55–64 | $398,900 | $411,900 | +3% | $1,878,000 |
| 65–74 | $448,600 | $431,300 | −4% | $1,897,600 |
| 75 or older | $367,300 | $504,900 | +37% | $1,962,200 |
| All families | $211,100 | $215,900 | +2% | $1,241,500 |
2022 figures are restated in 2025 dollars by the Fed.
One change stands out: in contrast with the previous few surveys, families 75 and older had the highest median and mean net worth of any age group, ahead of families near or recently in retirement, according to the report.
Median vs. mean: which number to use
The median is the middle family: half have more and half have less. The mean is the average, and a relatively small number of very wealthy families pulls it far higher. That's why the mean for all families, $1.24 million, is nearly six times the median. If you want to see where a typical household stands, use the median.
The Fed's report also shows how wide the spread is. Families in the top 10% of the income distribution had median net worth of about $3.67 million, while renters had a median of $10,600 and homeowners $458,900.
Why younger families fell behind
The Fed says the drop for families under 35, a 23% decline in the median and a 33% decline in the mean, was driven mainly by the unwinding of business equity gains these families had built between 2019 and 2022. Older families, by contrast, gained. The median for families 75 and older rose 37%.
Income moved differently from wealth. Real median family income rose 7% between the surveys, to $82,200, and every age group saw its median income grow. Families under 35 had a median income of $67,800, up 2%. Income in the survey is measured for the year before the interview, so the 2025 survey reflects 2024 income.
Signs of financial strain
Several measures in the same survey point to more families under pressure:
- Late payments: the share of families reporting they were behind on loan payments in the past year rose from 12.2% in 2022 to 19.6% in 2025, and 8.2% were 60 days late or more.
- Heavy payment burdens: the share of families whose debt payments exceeded 40% of income rose from 6.5% to 8.6%.
- Credit cards: about 45% of families carried a balance after their last payment. Among them, the median balance was $3,100, up $150, and the mean was $8,000.
- Housing: the homeownership rate held at 66%, but the Fed estimates that the payment on a 30-year fixed mortgage covering 80% of the median home's value, plus property taxes, took about 33% of monthly median family income, a high for the modern survey.
If credit card debt is part of your picture, our guides to the minimum payment trap and debt snowball vs. avalanche show how payoff order and payment size change the total cost.
How to use these numbers
A median by age is a reference point, not a scorecard. The survey describes families, not individuals, so a two-earner household and a single person in the same age group sit in the same row. It also can't tell you about local housing costs, student debt or whether your wealth is tied up in a home you live in.
A more useful comparison is with yourself over time. List what you own and what you owe once a year, and track the change. In the meantime:
- Build a cash cushion first. Our guide on how much emergency fund you need walks through the math.
- Use tax-advantaged accounts if you can. About 65% of families with a head 64 or younger had some retirement plan in 2025, and participation among families under 35 has risen notably over the past 15 years, according to the report. See the 2026 401(k) and IRA limits.
- Keep long-term investing simple and low-cost. Our comparison of index funds vs. ETFs explains the basics.
The Fed's SCF page has the full tables, an interactive chartbook and the public data for anyone who wants to dig deeper.
Sources
- Federal Reserve Board: press release on the 2025 Survey of Consumer Finances, Oct. 9, 2026.
- Federal Reserve Board: "Changes in U.S. Family Finances from 2022 to 2025: Evidence from the Survey of Consumer Finances," October 2026 (tables 1, 2, 4 and 5; boxes 2 and 4).
- Federal Reserve Board: Survey of Consumer Finances data page.
All sources were checked on Oct. 20, 2026.
This content is for general education and is not financial advice.